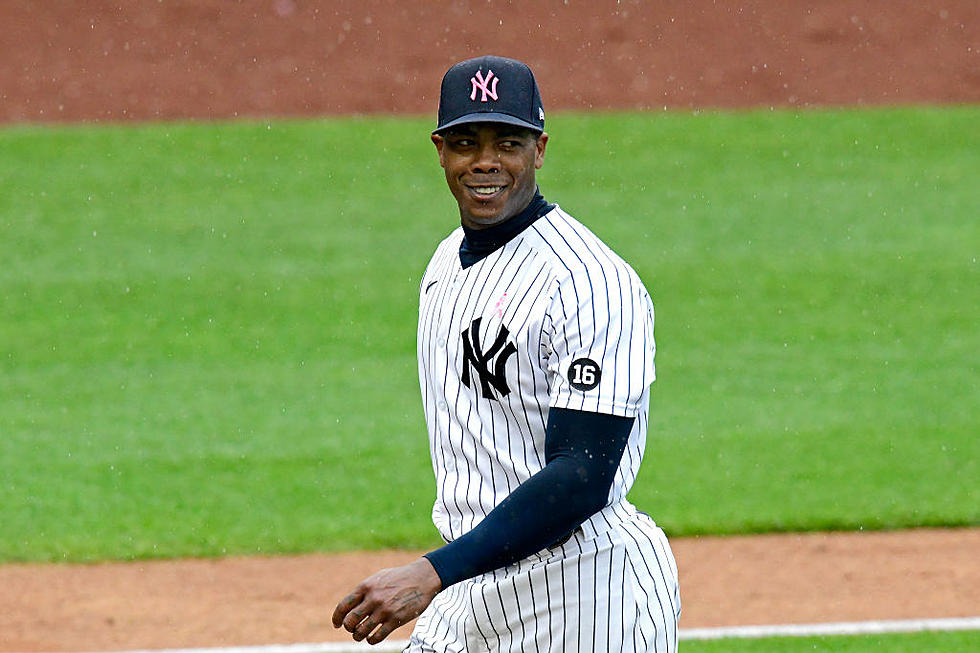
Four Stats That Prove Chapman is the Best in Baseball
For Aroldis Chapman, it certainly seems like less has been more.
We've remarked about it on Levack & Bahl many times, but Chapman does seem to be throwing the ball with less velocity, but more control. So, despite his fastball being a few MPH slower, it's in a better spot, which can be even more devastating to hitters.
Whether that's true, or he's doing something else, it's been working to near perfection. Thanks to a tweet from New York Yankees Stats, here are four statistics, and where he ranks in the league, that show he's the best in baseball at what he does so far this year.

Strikeout percentage (K%) - 58.6%
Rank: 1st
When you locate your pitches more, it will lead to more strikeouts. Plain and simple. Maybe the more telling stat is his strikeout to walk ratio, which at 50%, is also first in the majors.
Earned run average (ERA) - 0.00
Rank: T-1st
He gave an unearned run on May 8th, though. What a BUM.
Fielding Independent Pitching (FIP) - -0.18
Rank: 1st
This statistic measures events that are completely in the pitcher's control: strikeouts, walks, etc. So, I Google'd how a statistic like this can be negative, and found an article from 2012. Believe it or not, it was ABOUT AROLDIS CHAPMAN. Whether it be statistics or the sound barrier, this guy loves breaking things.
FanGraphs WAR or Fielding Independent Pitching WAR (fWAR) - 1.2
Rank: T-1st
There are very few statistics that blatantly tell you a player's value. WAR, or wins above replacement, will tell you exactly that. The FanGraphs equation proves that based on what a pitcher can control (walks, strikeouts, etc.), Chapman has been better than anyone else in his position in comparison to the "replacement".
Even as a (filthy) Red Sox fan, I can admit it...Chapman has been simply the best.
LOOK: 50 images of winning moments from sports history
More From 920 ESPN New Jersey


![Watch NY Yankees’ Fans Give This Controversial Politician a Warm Welcome [NSFW]](http://townsquare.media/site/78/files/2022/10/attachment-Ted-Cruz-at-Yankee-Stadium.jpg?w=980&q=75)

![New York’s Yankee Stadium Was Literally Falling Apart Yesterday [VIRAL VIDEO]](http://townsquare.media/site/78/files/2022/10/attachment-Yankees-Grease-Fire.jpg?w=980&q=75)
